Just six days ago, at the time of writing, Anthropic introduced Claude Dashboard, a new capability that allows people to create interactive, data-driven dashboards through the increasingly familiar chat interface within Claude. It's currently available in Beta for anyone with a Claude subscription.
Using Claude Dashboard, rather than manually building charts, configuring layouts and connecting individual data sources, you can simply describe what you want to understand, and Claude constructs the dashboard (or dashboards) for you.
It's an interesting proposition, particularly for organisations looking to make business information more accessible without requiring specialist reporting skills. Claude Dashboard will happily connect to a set of common data sources and off you go.
But we wanted to see whether we could take it a step further.
Connecting to Power BI
Many organisations have invested heavily in Microsoft Power BI, not just in creating reports and dashboards, but in developing the underlying semantic models that support them. For those less familiar with Power BI semantic models, they provide a business-oriented layer over the underlying data, defining relationships, hierarchies and calculations that establish how the organisation measures its performance.
These models represent considerable investment in both engineering and business knowledge. They provide a consistent, reusable analytical foundation rather than requiring every report or application to interpret the raw data independently.
Rather than connecting Claude Dashboards directly to a database and asking it to work everything out from scratch, we wanted to see whether we could connect it to an existing Power BI semantic model.
Could Claude discover the model, understand the available information and build a complete analytical application using the business logic already established in Power BI with minimal instructions on my part?
Setting Up the Experiment
Claude Dashboards is built into the broader Claude environment, which means it is heavily extensible and can take advantage of additional connectors and skills. For this experiment, we configured the necessary Azure connectivity and incorporated Microsoft's Fabric Skills, which provide guidance and capabilities for working with Power BI semantic models and reports.
For the data, we used Microsoft's familiar AdventureWorks sample database. We had previously built a Power BI semantic model over AdventureWorks, complete with relationships, measures and several reports, although importantly none of the reports were referenced during this experiment. Instead, we wanted Claude to develop its own interpretation of the business, using the semantic model as a guide rather than copying existing reporting designs.
From a Simple Prompt to an Executive Dashboard
The instructions we gave Claude were deliberately simple:
Design a multi-page dashboard that would serve an Executive Team looking at all facets of the AdventureWorks business.
To make it generate a variety of chart styles we added this instruction:
I want this to really be a showcase of charting possibilities. Implement a range of visuals that showcase different visualisation types, still ensuring that the visualisation choices make sense. Ensure that we have cross-filtering enabled where it makes sense so that all panels on the dashboard feel coherent.
Finally to tailor the style we attached a single screenshot taken from Claude's own promotional launch video for Claude Dashboard as a visual reference.
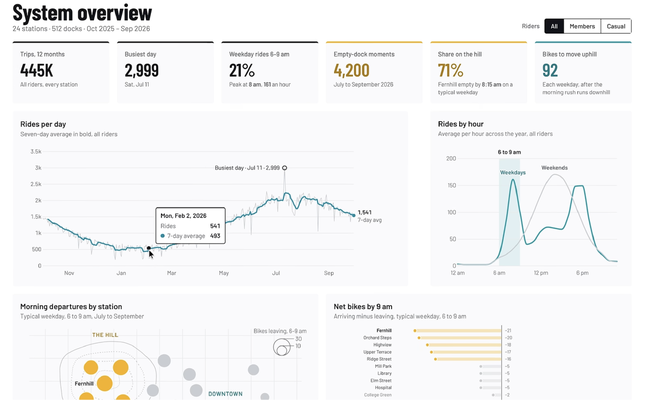
This was all entered as a single prompt and Claude got to work. It analysed the semantic model, came up with different perspectives of business performance, chose the chart types and arranged the whole thing. It also happily inferred the colour palette, typography, layout conventions, visual hierarchy and navigation style from the screenshot I supplied.
The Results
The first prompt produced a fully interactive and connected dashboard with four pages, each one looking at a different aspect of the business. This was not a static mock-up, a collection of charts using exported data, or a design that still needed to be manually implemented, it was a live, fully functioning dashboard open to further tweaks and alterations if need be via a simple prompt.
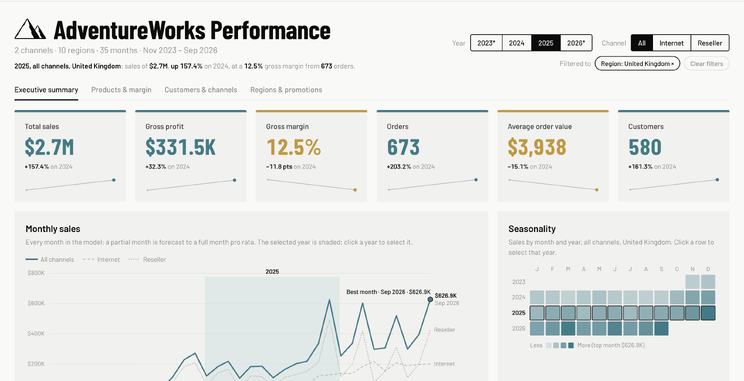
This is a synthesised example. AdventureWorks is not a real business, but within an extremely short period of time, Claude Dashboard was able to analyse a semantic model, design visually attractive dashboards and implement a fully functioning analytical application in 15 minutes (and I'm being deliberately conservative here).
Does This Change the Role of Power BI?
This experiment doesn't demonstrate that Power BI is obsolete, at least not yet anyway. In some ways it demonstrates the opposite case because it shows how tools like Claude Dashboard can become even more valuable sitting on top of a well-architected, governed and trusted semantic model.
What becomes less certain though, at least for certain use cases, is the traditional report-authoring process. In this quick example we didn't need to open Power BI Desktop, manually arrange visuals, configure individual charts or publish a conventional Power BI report. Instead, Claude handled the entire design and construction of the analytical interface. The result is visually pleasing and functionally intuitive and the data and definitions are served from the existing Power BI semantic model.
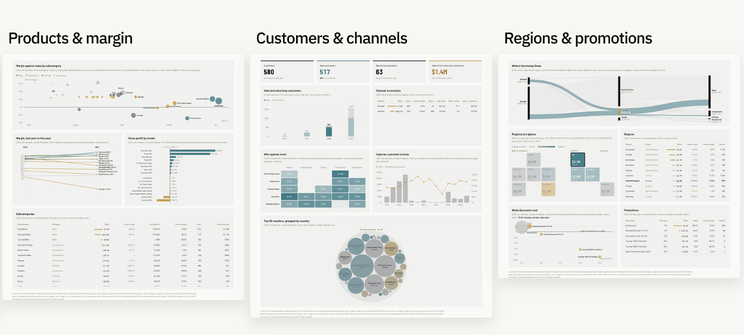
This represents a potentially significant change in how business intelligence applications are going to developed going forward. It also raises an interesting question about where the value in a modern BI platform really sits. Is it in the reporting interface, or is it in the quality, consistency and accessibility of the underlying analytical model? I would say it is undoubtedly the latter.
What About the Limitations?
There are some important qualifications that need to be made here. Claude Dashboard is still in beta, and this experiment shouldn't be interpreted as demonstrating feature parity with Power BI.
Enterprise reporting involves considerably more than presenting information. Power BI provides an established environment for access control, row-level security, governance, deployment, distribution and the management of reporting assets across an organisation and these capabilities don't automatically carry over simply because an external application can query a Power BI semantic model.
Security is a particularly important consideration. Access to the model must be properly authenticated and authorised, and any row-level restrictions need to be enforced through the underlying connection rather than assumed to exist in the dashboard.
There is also the question of where the application lives. Claude Dashboard operates within the Claude environment and it is currently being envisaged as an individual analysis tool as an opposed to a governed reporting factory. Although it is technically possible to deploy dashboards produced by Claude Dashboard externally it is not a capability built into the current workflow of the product.
Testing and validation of the results still need to be completed to ensure that the produced dashboard, with all of its good intentions, is not inaccurate or misrepresenting the numbers.
These are important considerations, but they don't diminish what the experiment demonstrates, instead they highlight some of the engineering and governance work required to take ideas like this into production.
Where Does This Lead?
AI-enabled applications like Claude Dashboard have obvious productivity benefits for existing reporting teams, but they also promise to make business intelligence accessible to a much broader audience. This creates an interesting tension. Organisations have traditionally relied on specialist teams to develop curated, validated reports that provide a consistent view of business performance.
Suddenly giving everyone the ability to create their own dashboards could just as easily introduce confusion and inconsistency as it could improve access to information, but this is precisely why the underlying analytical model matters. Organisations have spent years developing data warehouses, dimensional models and semantic layers to establish a consistent view of their businesses. These investments provide a foundation upon which AI-generated analytical applications can be built without having to reinvent the business logic every time. The emergence of tools like Claude Dashboard doesn't diminish the value of that work; they potentially makes it considerably more valuable.
What is undeniable is that something which once required a specialist to design and construct can now begin with a business objective expressed in natural language. There is still a place for deliberate design, validation, security and governance, but the amount of manual work required to get from a business question to a functioning analytical application is changing dramatically.
Perhaps the future of business intelligence isn't about everyone becoming a report developer. It's about giving everyone the ability to explore trusted business information without needing to be one.