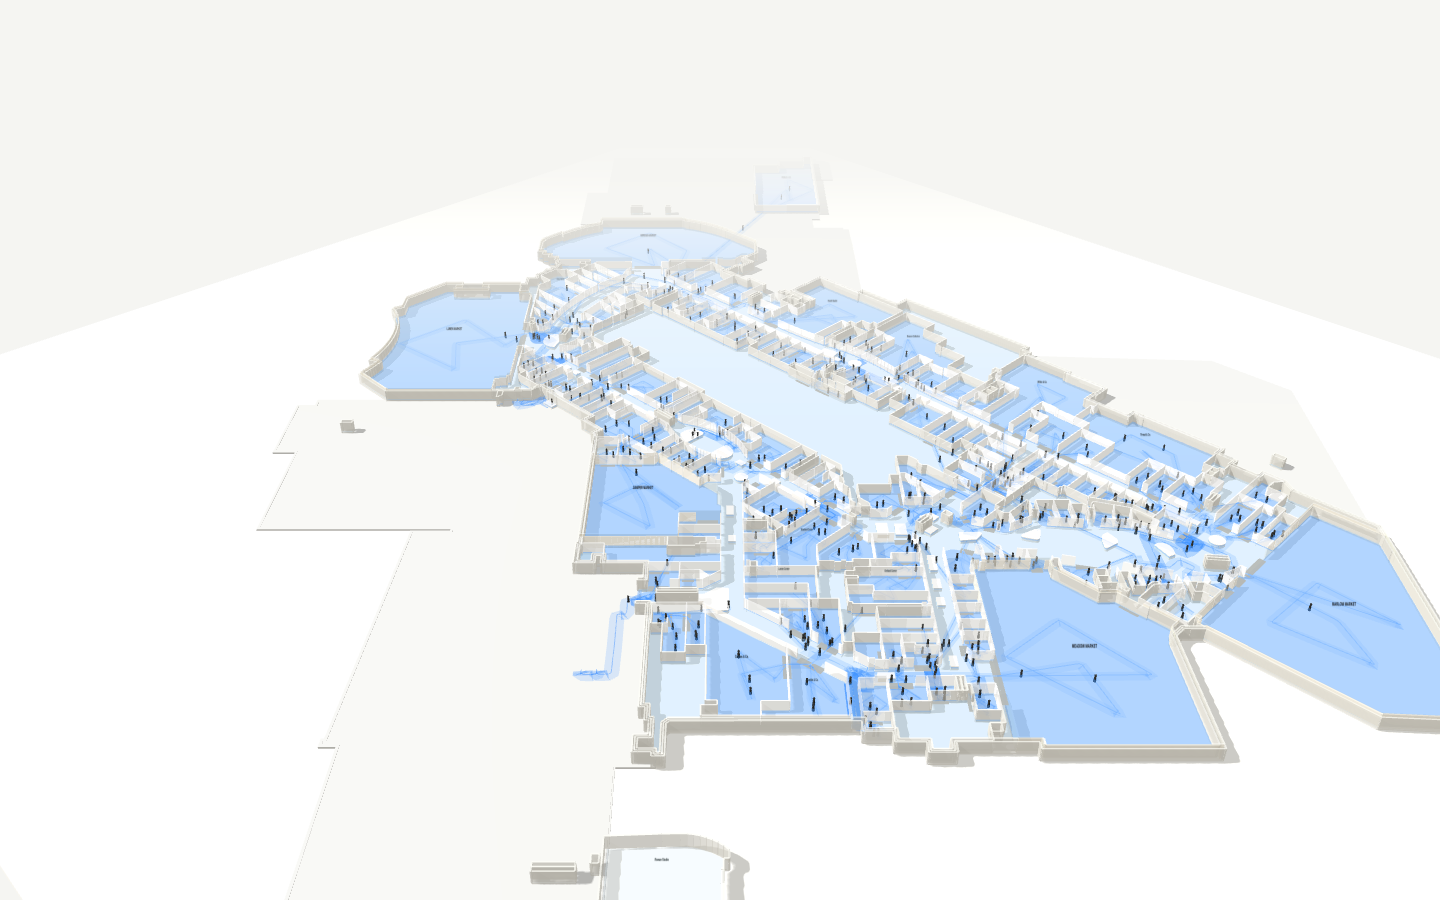
The Centre Model
Explore a three-dimensional shopping-centre digital twin with simulated customer flow, dwell and retail-performance overlays.
The Lab is where Datashow stretches — visualisation prototypes, AI tools, modelling demos, embedded BI experiments. Some become products. Some become posts. Some quietly die.
Explore a three-dimensional shopping-centre digital twin with simulated customer flow, dwell and retail-performance overlays.
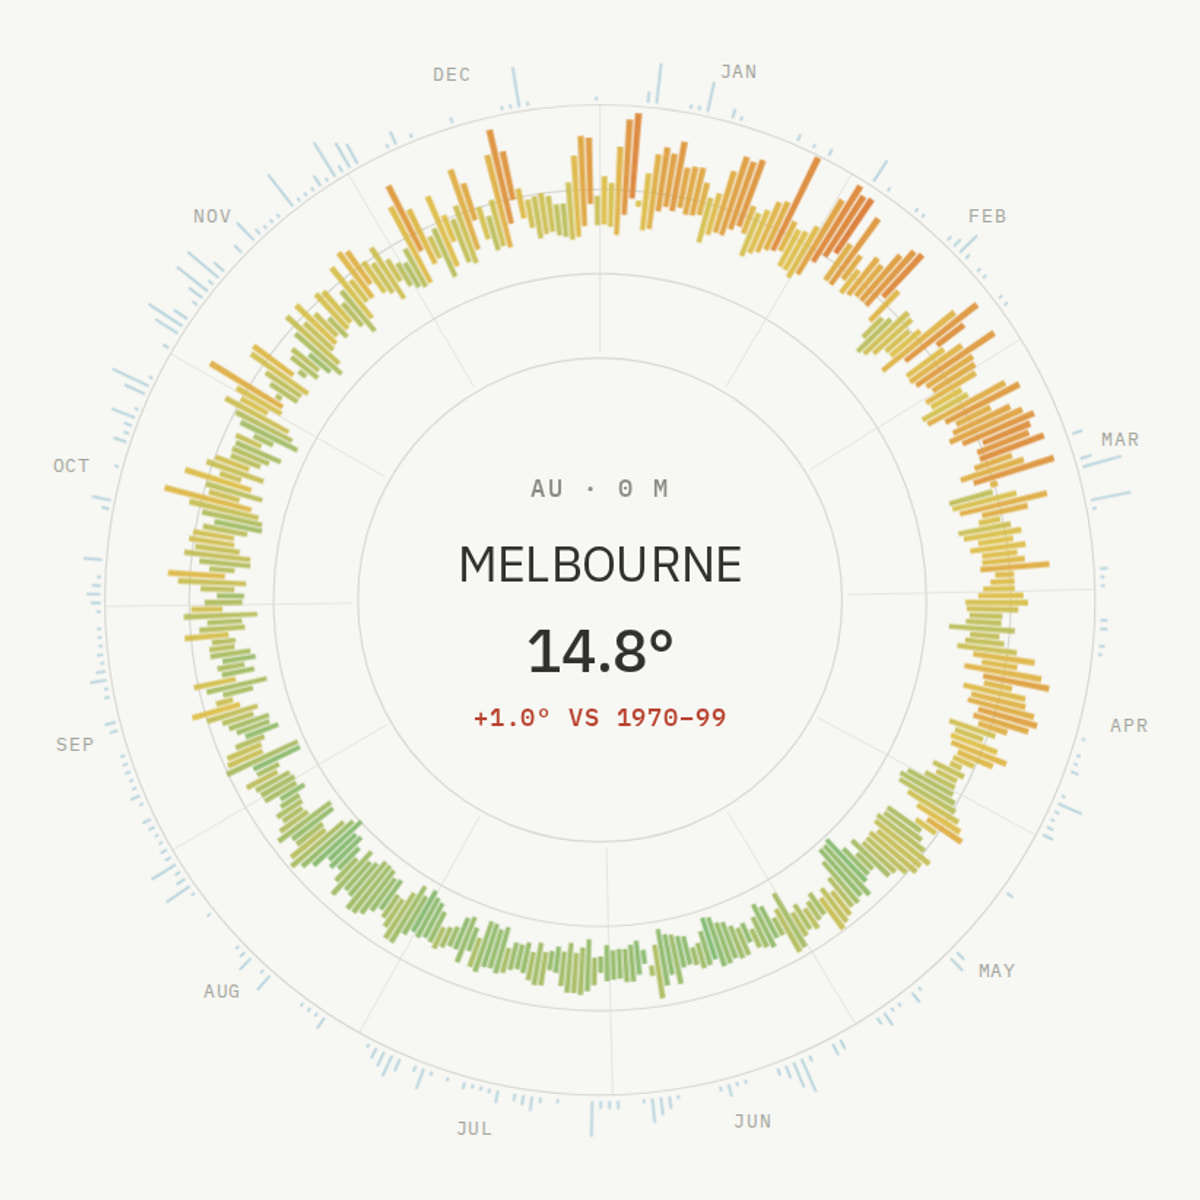
Compare the shape of city climates across hemispheres as daily temperature ranges and rainfall change from 2000 to 2025.
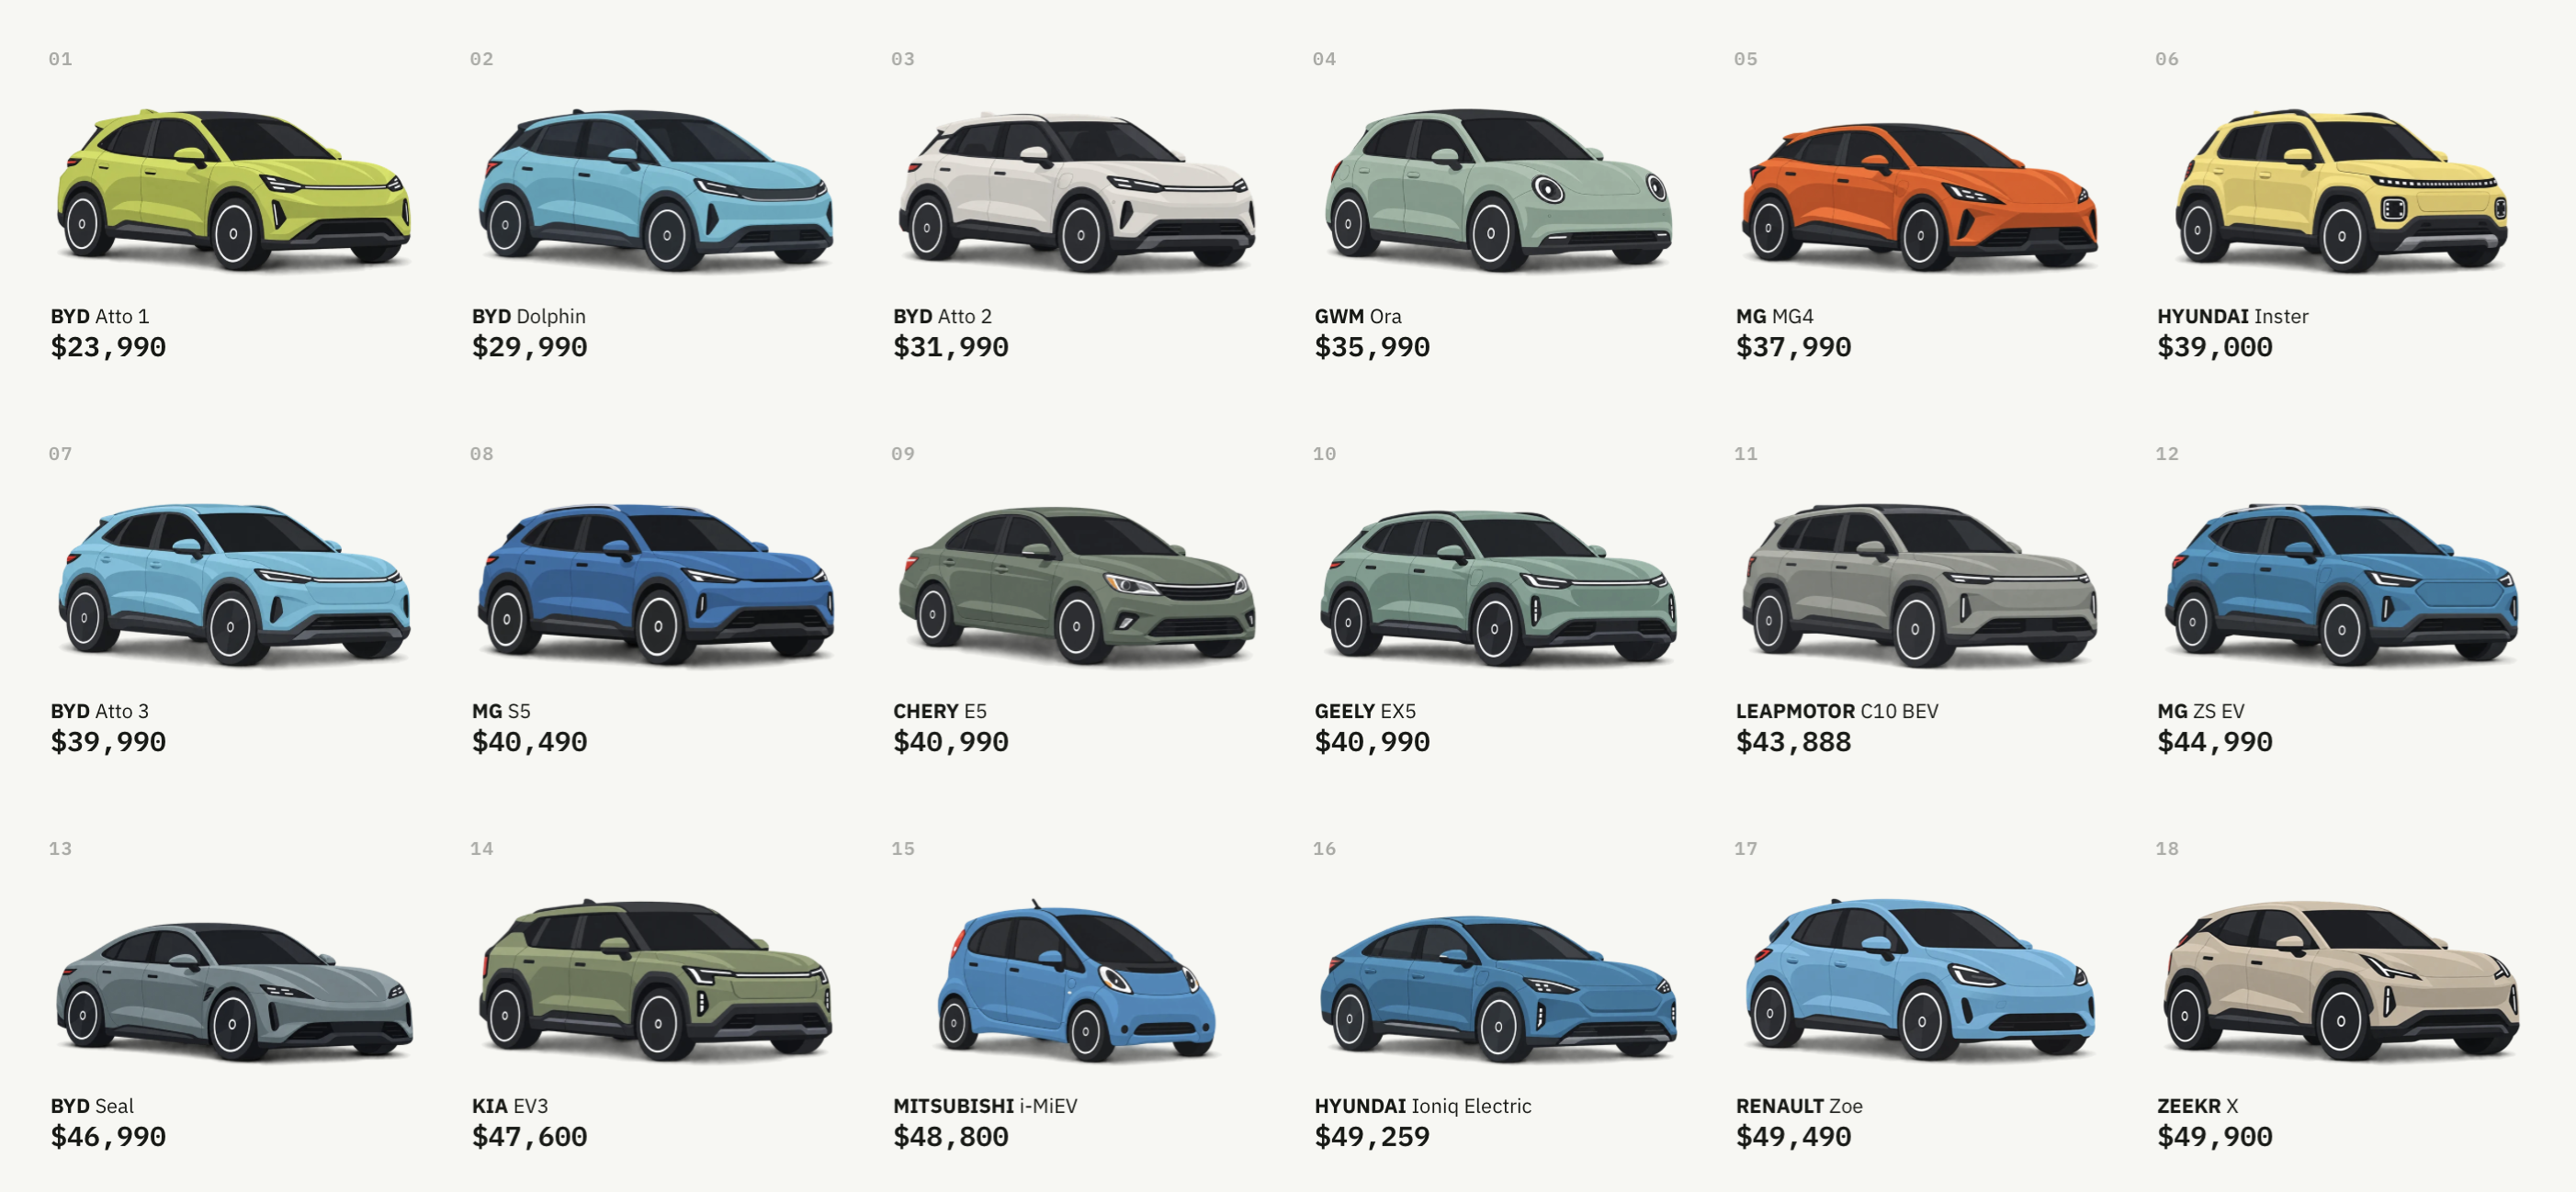
Replay the Australian battery-electric market as models enter, leave and rearrange themselves by manufacturer list price.
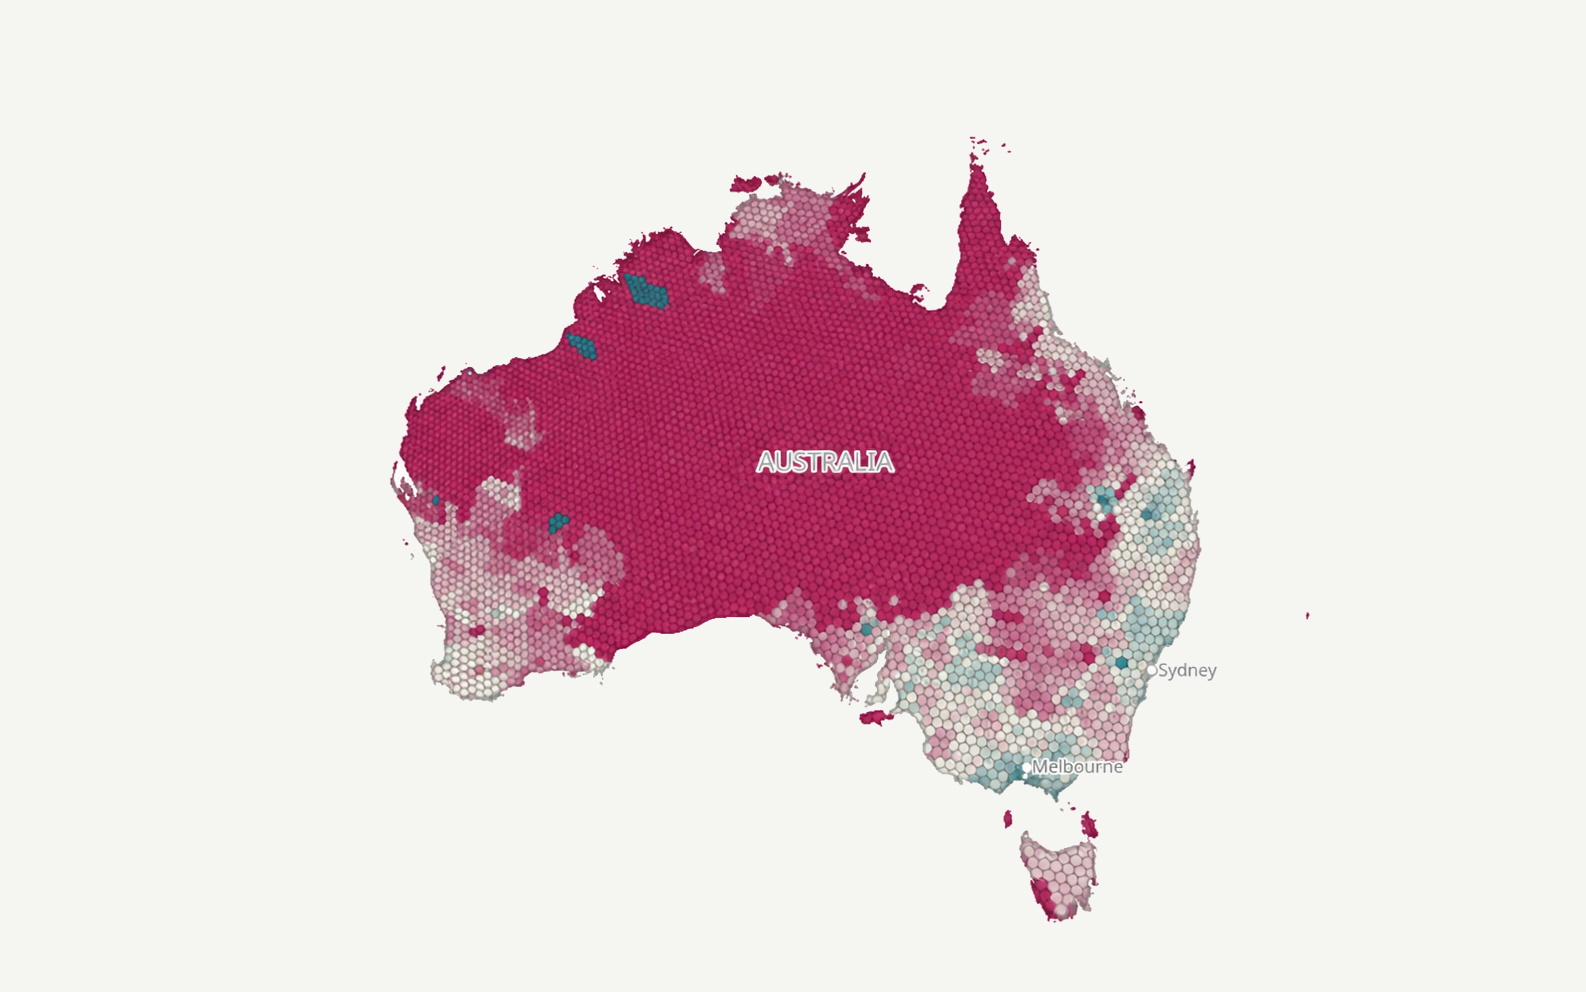
Inspect live and replayed fuel prices across stations and regional price surfaces.
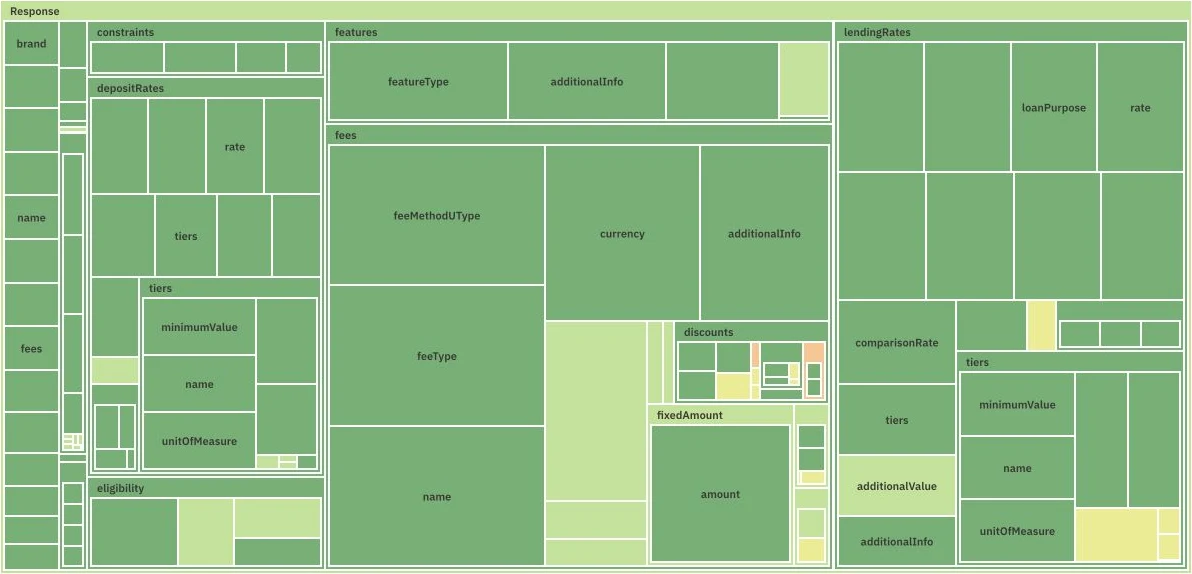
Inspect Australian Consumer Data Right product reference data, lineage and ecosystem quality.
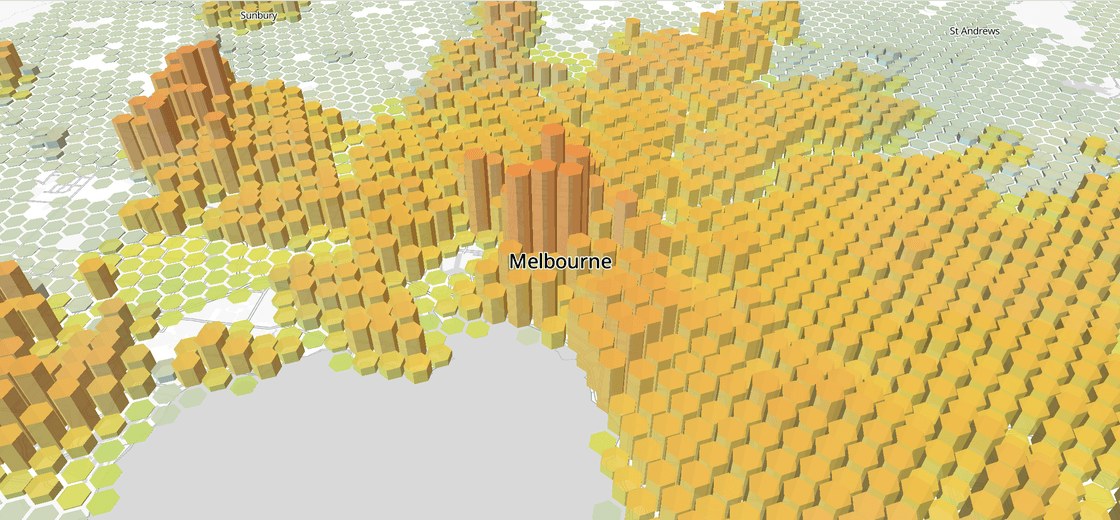
Explore how urban population, prosperity and economic mass are distributed through space and time.
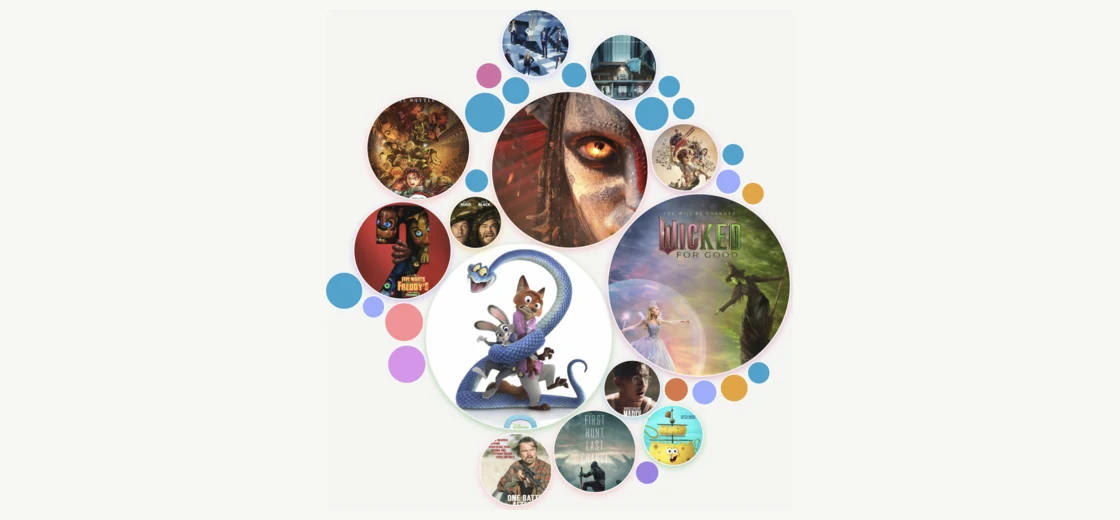
Replay the cinema market as a living field of films, where every release grows with its theatrical momentum and moves through the cinema calendar.
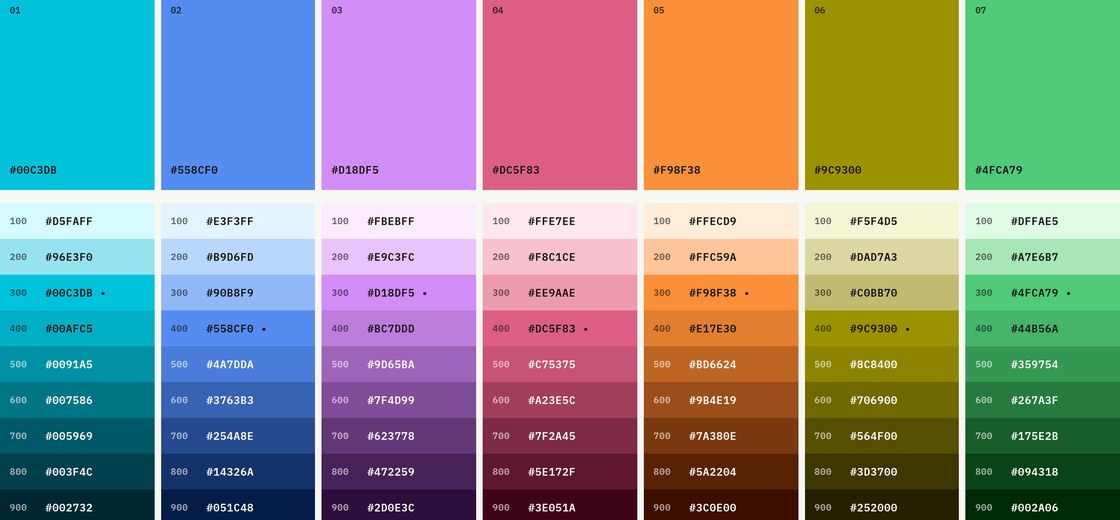
A perceptually-driven palette designer for data visualisation, helping you create colour scales that are both beautiful and maximise readability. Build sequential, diverging, categorical and custom palettes and instantly preview them on charts and maps.
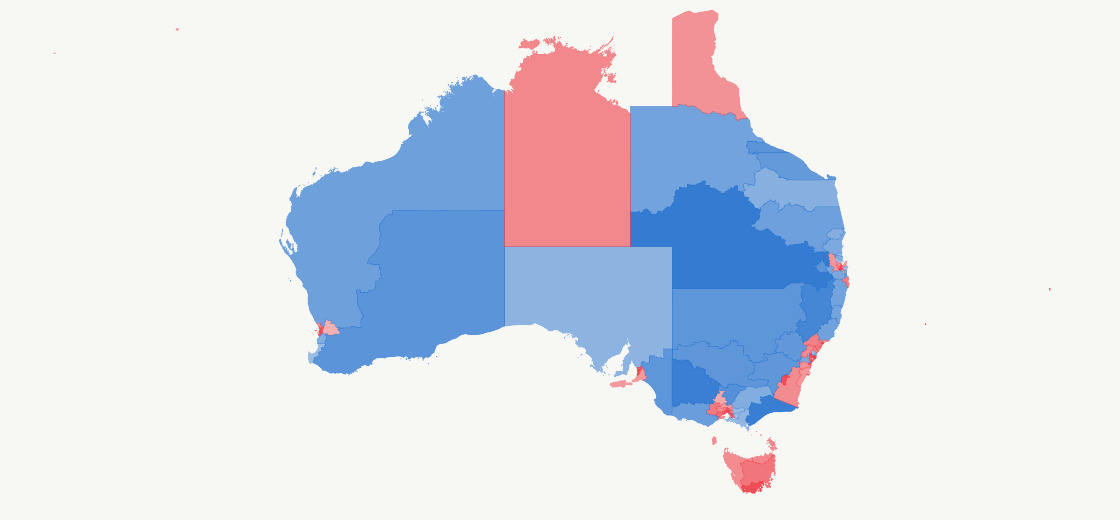
Examine two decades of Australian federal election results across electorate maps, seat cartograms and the House chamber. Compare electoral shifts across seven elections, inspect booth-level results and replay the live counts from 2010, 2016, 2019, 2022 and 2025.