Same brief. Same data. Very different results.
What happens when you give two AI design tools exactly the same brief, access to the same live data, and complete creative freedom?
The challenge was to build a Victorian Public Transport Command Centre. A fully interactive application for network operators and executives to understand service performance, identify disruptions and investigate emerging operational issues.
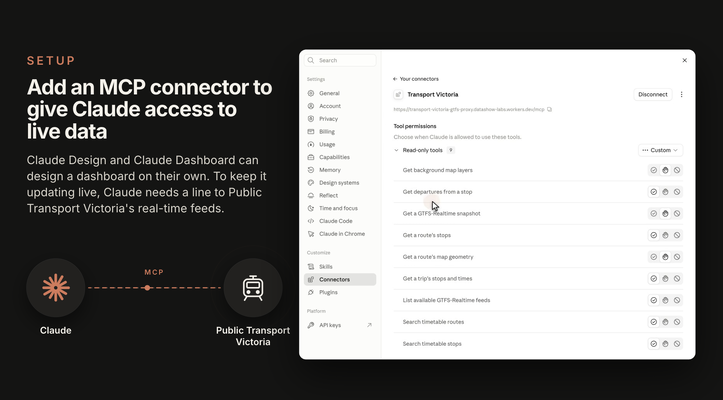
Before starting, we needed a way to give Claude access to the available schema and the underlying live data so that it could understand more about the subject area and also determine what was feasible based on the data available. To do this we built an MCP proxy service over Public Transport Victoria's GTFS and GTFS Realtime feeds, allowing both Claude Dashboard and Claude Design to independently discover and interrogate the available operational data. This gave Claude access to routes, route geometry, timetables, services, vehicle positions and more.
The brief was deliberately open-ended. Neither tool was given a prescribed layout, set of KPIs, visualisations or navigation structure.
Instead, we asked them to:
- Explore the available data independently.
- Determine what operational insights could genuinely be derived.
- Design for both network operators and executives.
- Build a functioning, interactive application rather than a static mock-up.
- Avoid inventing data, metrics or operational conclusions.
- Make their own design and technical decisions.
The objective wasn't simply to produce a beautiful dashboard, it was to see how each system would interpret a real business problem and translate it into a useful operational application.
The results were fascinating, and each service produced very different designs.
- Claude Design produced a dark, operational command centre, with a prominent network map, status indicators and an emphasis on identifying issues that need attention.
- Claude Dashboard produced a lighter, more editorial analytical interface, with performance summaries and structured reporting views.
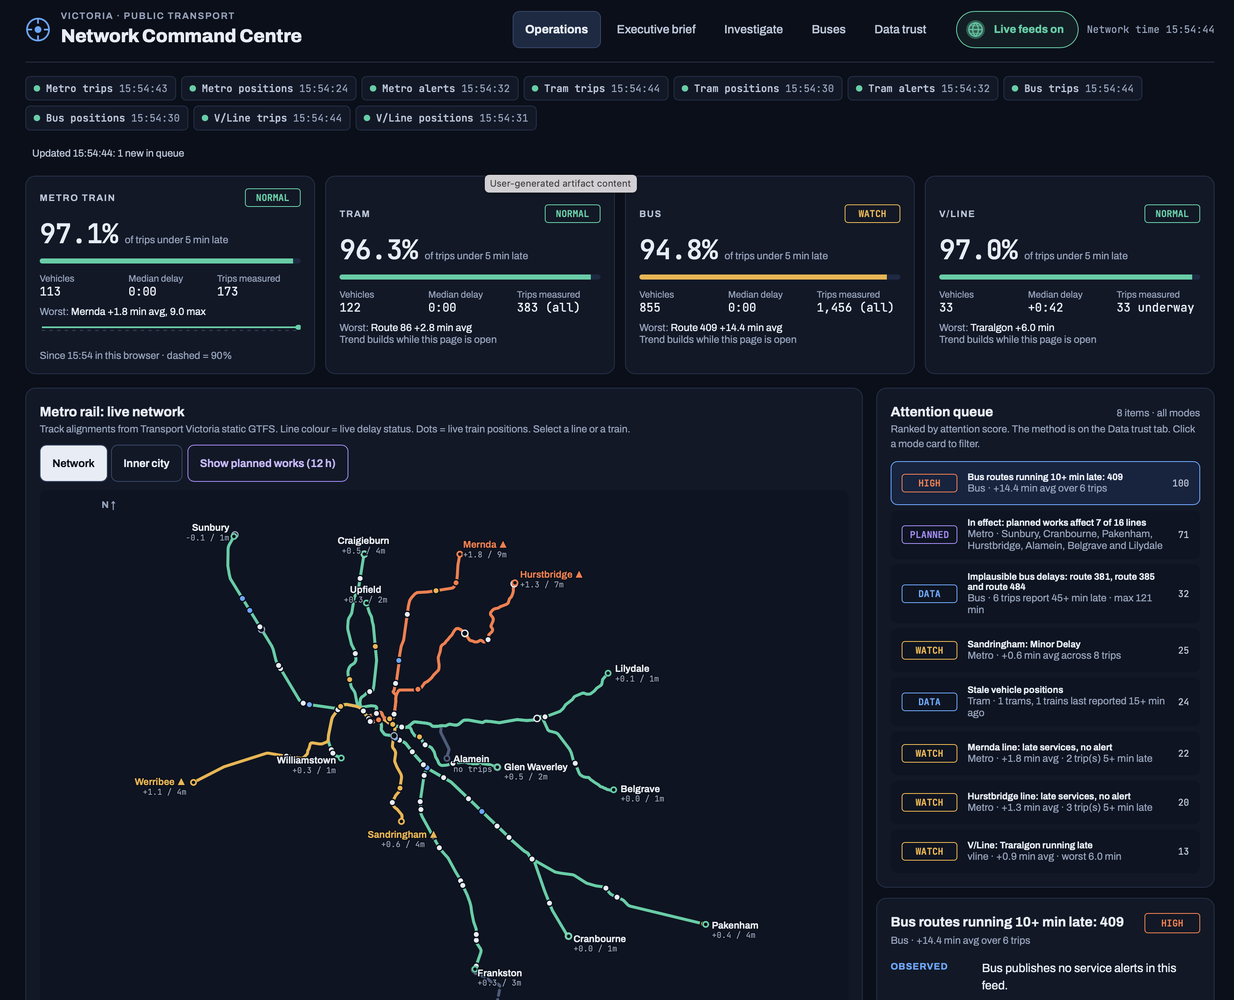
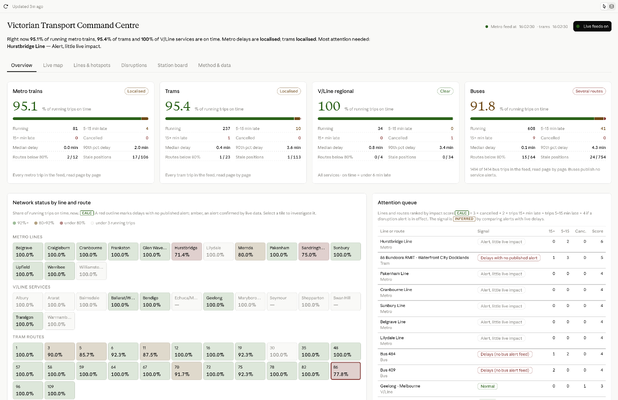
Both were working from the same brief and the same underlying data, yet arrived at very different interpretations of what a Command Centre should be.
I don't want to declare a winner, although I naturally have my own preferences, but I was more interested in getting feedback on what people think about the designs that were produced and which one you naturally prefer. Why do you prefer one over the other, or is it a case of taking the best elements from each design.
#ClaudeAI #ClaudeDashboard #ClaudeDesign #UIDesign #DataVisualisation #BusinessIntelligence #AI